Create interactive slides with Python in 8 Jupyter Notebook cells
Creating presentations in Jupyter Notebook is a great alternative to manually updating slides in other presentation creation software. If your data changes, you just re-execute the cell and slide chart is updated.
Jupyter Notebook is using Reveal.js (opens in a new tab) for creating slides from cells. The standard approach is to write slides code and Markdown in the Jupyter Notebook. When notebook is ready, it can be exported to standalone HTML file with presentation.
What if, you would like to update slides during the slide show? What is more, it would be fantastic to have interactive widgets in the presentation. You can do this in Mercury framework.
In this tutorial, we will create an interactive presentation in Jupyter Notebook and serve it with Mercury.
Create presentation in notebook
Please enable Slideshow toolbar in Jupyter Notebook. It can be done by clicking View->Cell Toolbar->Slideshow. It is presented in the screenshot below:

We will need following packages to create presentation in Python notebook:
numpy
matplotlib
mercury
Please make sure that they are installed in your environment.
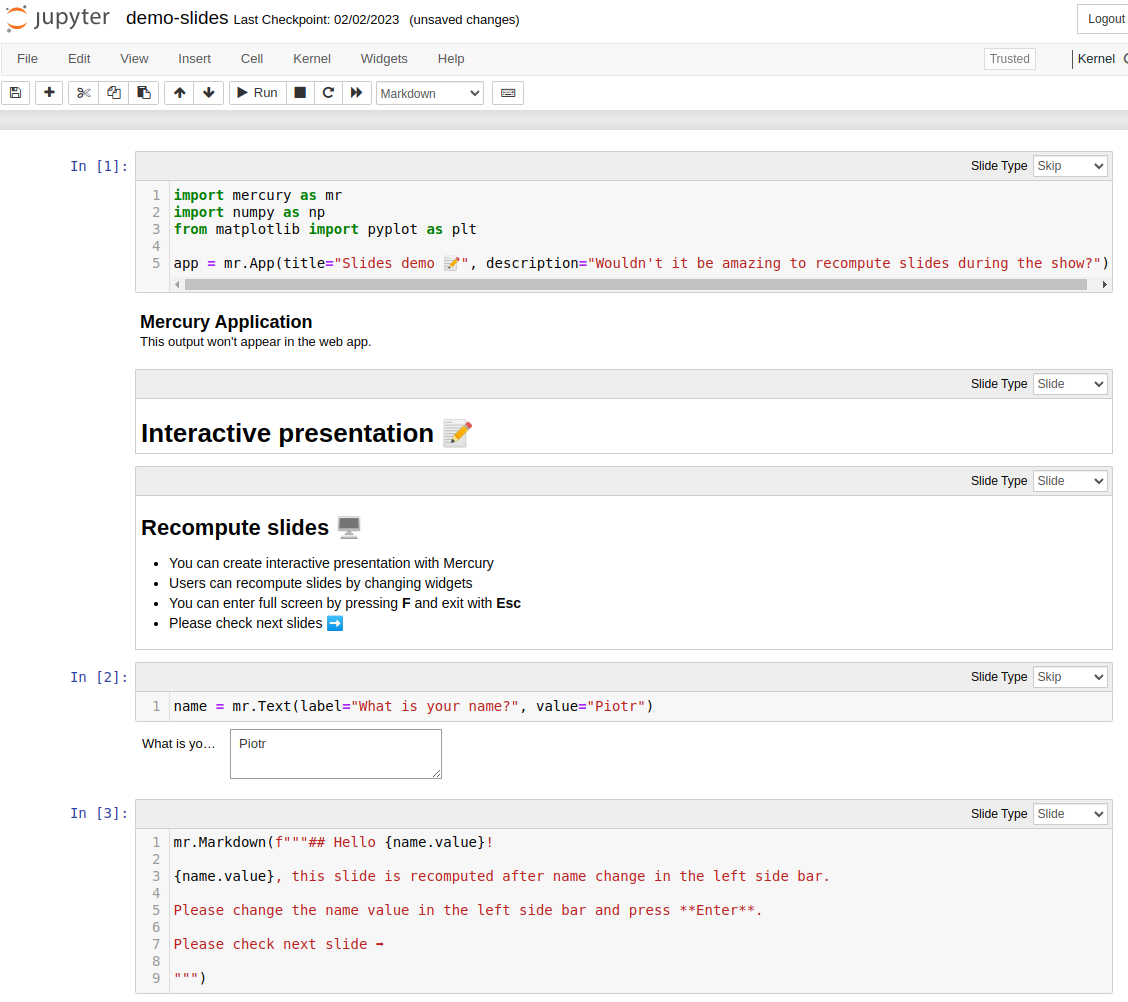
1. Import packages and App setup
The first step is to import packages and setup Mercury App:
import mercury as mr
import numpy as np
from matplotlib import pyplot as plt

app = mr.App(title="Slides demo 📝", description="Wouldn't it be amazing to recompute slides during the show?")
We setup title and description for App object.
Please note that we set Slide Type to Skip. This cell will not appear in the presentation.
2. Add title
The second cell is a Markdown with title:
# Interactive presentation 📝The Slide Type is set to Slide. It is our first slide!
3. Add slide with Markdown
Add new Markdown cell with the following cell.
## Recompute slides 🖥️

- You can create interactive presentation with Mercury
- Users can recompute slides by changing widgets
- You can enter full screen by pressing **F** and exit with **Esc**
- Please check next slides ➡️
Please set Slide Type to Slide. It will be a second slide. I'm using ## as slide title (# will produce too large title in my opinion).
4. Add Mercury Widget
Please add code cell with Text widget. We will use it, to ask users about their name.
name = mr.Text(label="What is your name?", value="Piotr")We set Slide Type as Skip, so this cell will not appear in the presentation.
5. Display name
Let's use the name.value in the slide. Please add a code cell.
We will display a Markdown text with Python variables by using Markdown function from Mercury package.
mr.Markdown(f"""## Hello {name.value}!

{name.value}, this slide is recomputed after name change in the left side bar.

Please change the name value in the left side bar and press **Enter**.

Please check next slide ➡️

""")
Please set the Slide Type to Slide.
You can display Markdown with Python variables by calling mr.Markdown() or mr.Md() functions.
Both do the same.
The first five cells of the notebook:

You can enter your name in the widget during the notebook development. There will be no change in other cells. If you want to update the cell with new widget value, please execute it manually.
6. More widgets
We can add more widgets to the presentation. They will be used to control chart in the next slide.
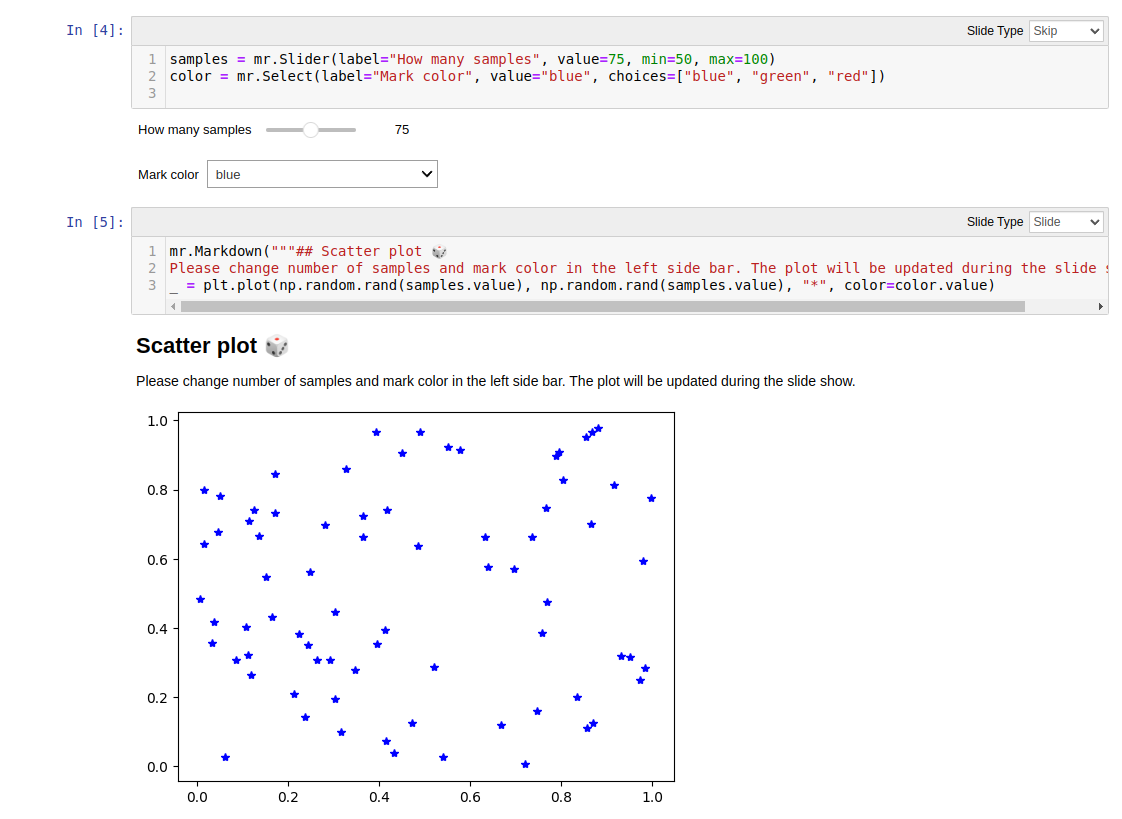
samples = mr.Slider(label="How many samples", value=75, min=50, max=100)
color = mr.Select(label="Mark color", value="blue", choices=["blue", "green", "red"])
We have used Slider and Select widgets. They are displayed in the notebook.
This cell will not be displayed in the presentation, so set Slide Type to Skip.
7. Scatter plot
We will add a new code cell. It will have Slide Type set to Slide.
mr.Markdown("""## Scatter plot 🎲
Please change number of samples and mark color in the left side bar. The plot will be updated during the slide show.""")
_ = plt.plot(np.random.rand(samples.value), np.random.rand(samples.value), "*", color=color.value)
We used widgets values by accessing them with samples.value and color.value.
Screenshot of the notebook with scatter plot:

8. Final slide
Please add a last Markdown cell. Its Slide Type will be set to Slide:
## Thank you!

Please check our documentation at <a href="https://runmercury.com" target="_blank">RunMercury.com</a> for more information 📚
Please notice that link is added with HTML syntax. There is a target="_blank" used to open link in a new tab.
Run presentation in Mercury
Please run Mercury local server in the same directory as notebook:
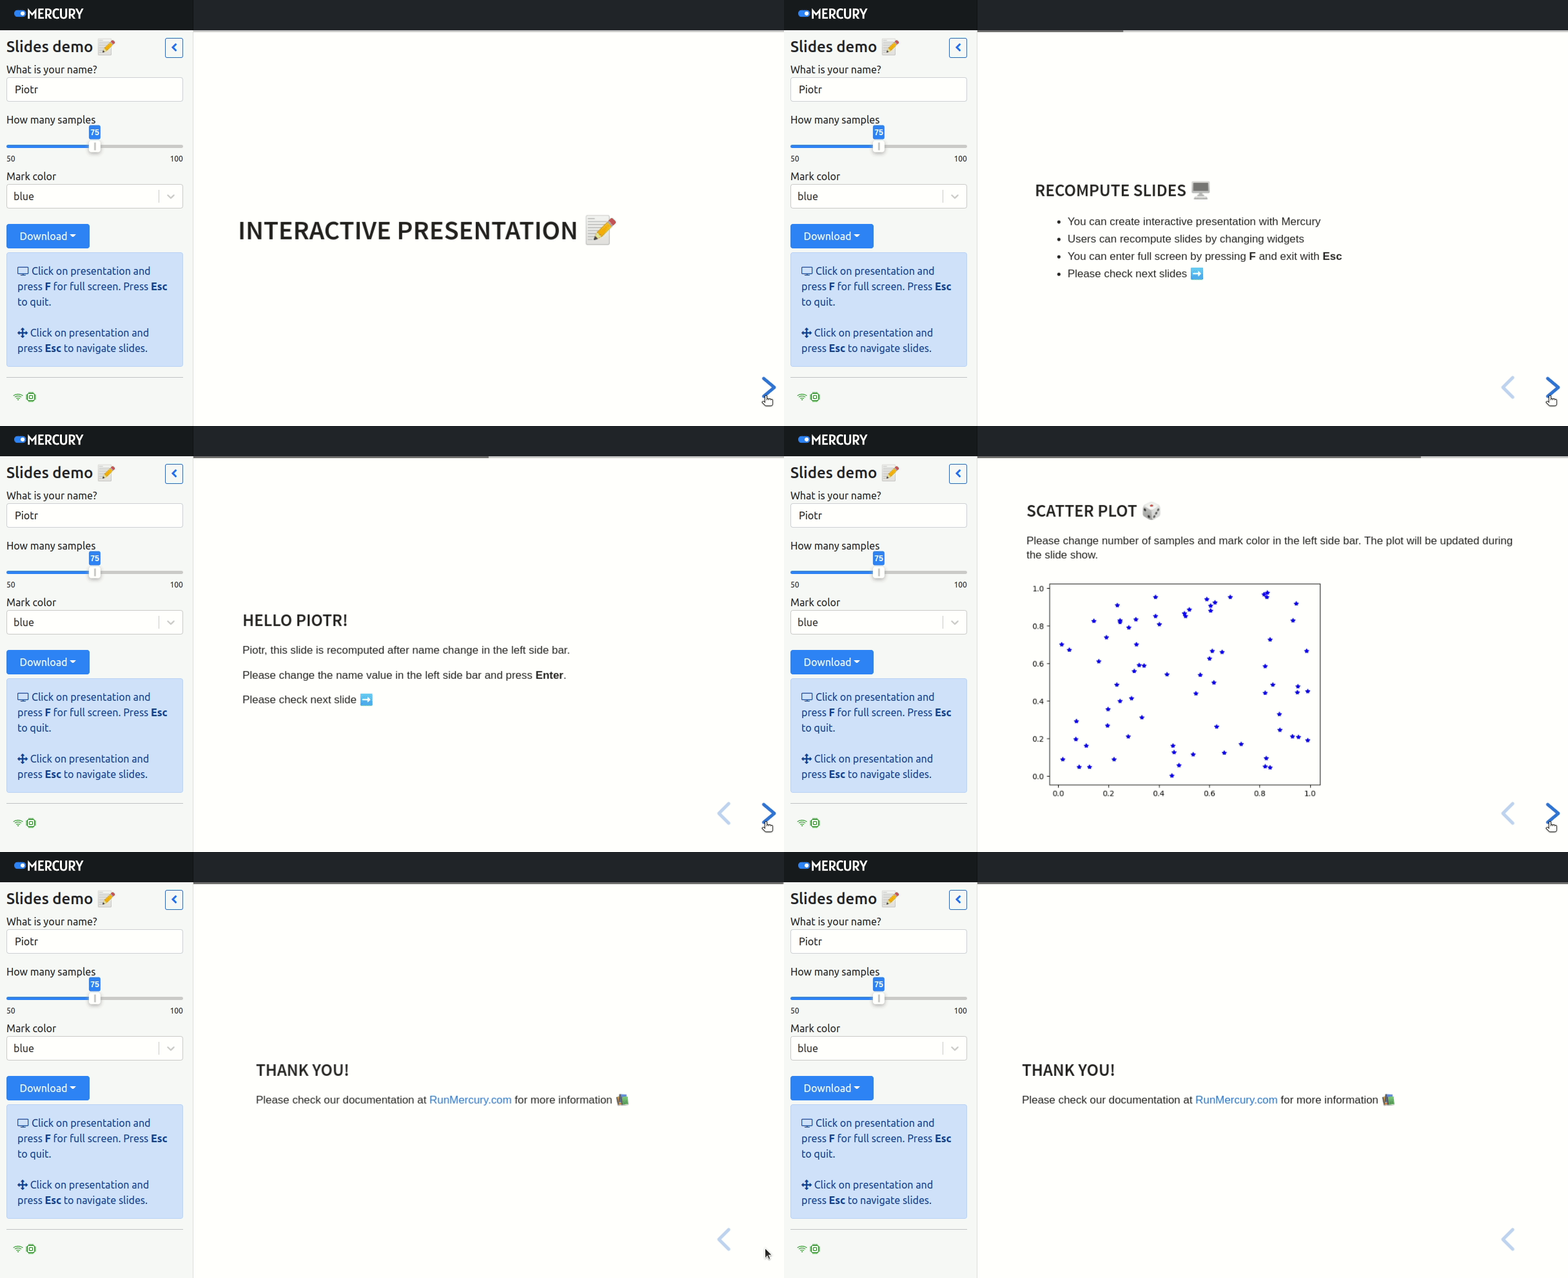
mercury runThe above command will open a web browser at http://127.0.0.1:8000. Please click on a card with presentation.
You can navigate between slides with arrows in the bottom right corner. You can enter the full screen mode by pressing F on the keyboard. Please use Esc to exit full screen mode.

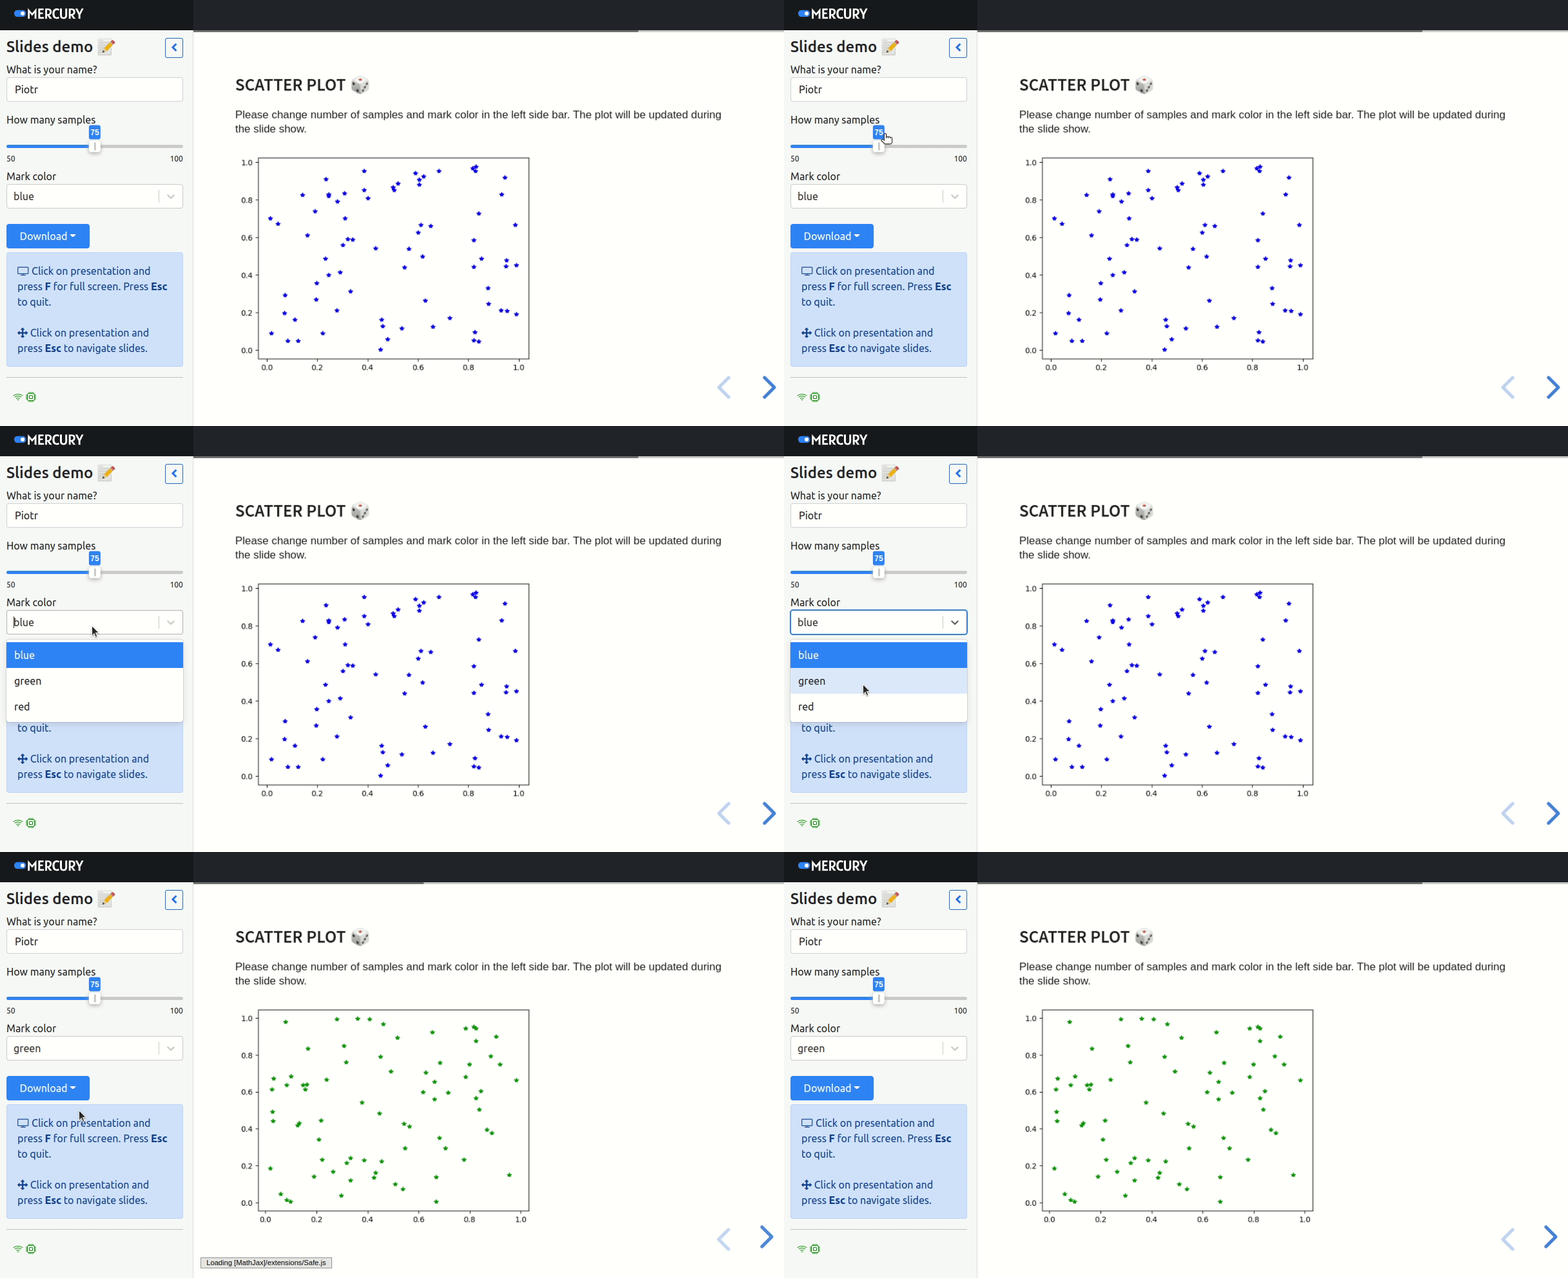
You can change widgets values in the sidebar and presentation slides will be automatically recomputed:

You can export your slides as PDF or HTML by clicking Download button in the sidebar.