Create Dark Matplotlib Plots
Matplotlib is one of the most popular Python packages for creating charts. It works great in notebooks and it also works very well in Mercury apps.
When you use a dark theme in your Mercury app, the default Matplotlib plot can look too bright. A white chart on a dark dashboard often breaks the visual style.
The good news is that it is very easy to create dark Matplotlib plots. You can use a built-in Matplotlib style or define your own custom colors.
1. Install Dependencies
Section titled “1. Install Dependencies”First, install Mercury, Matplotlib, and NumPy.
# pip install mercury matplotlib numpyThen import the packages:
import mercury as mrimport matplotlib.pyplot as pltimport matplotlibimport numpy as np2. Use a Built-in Dark Style
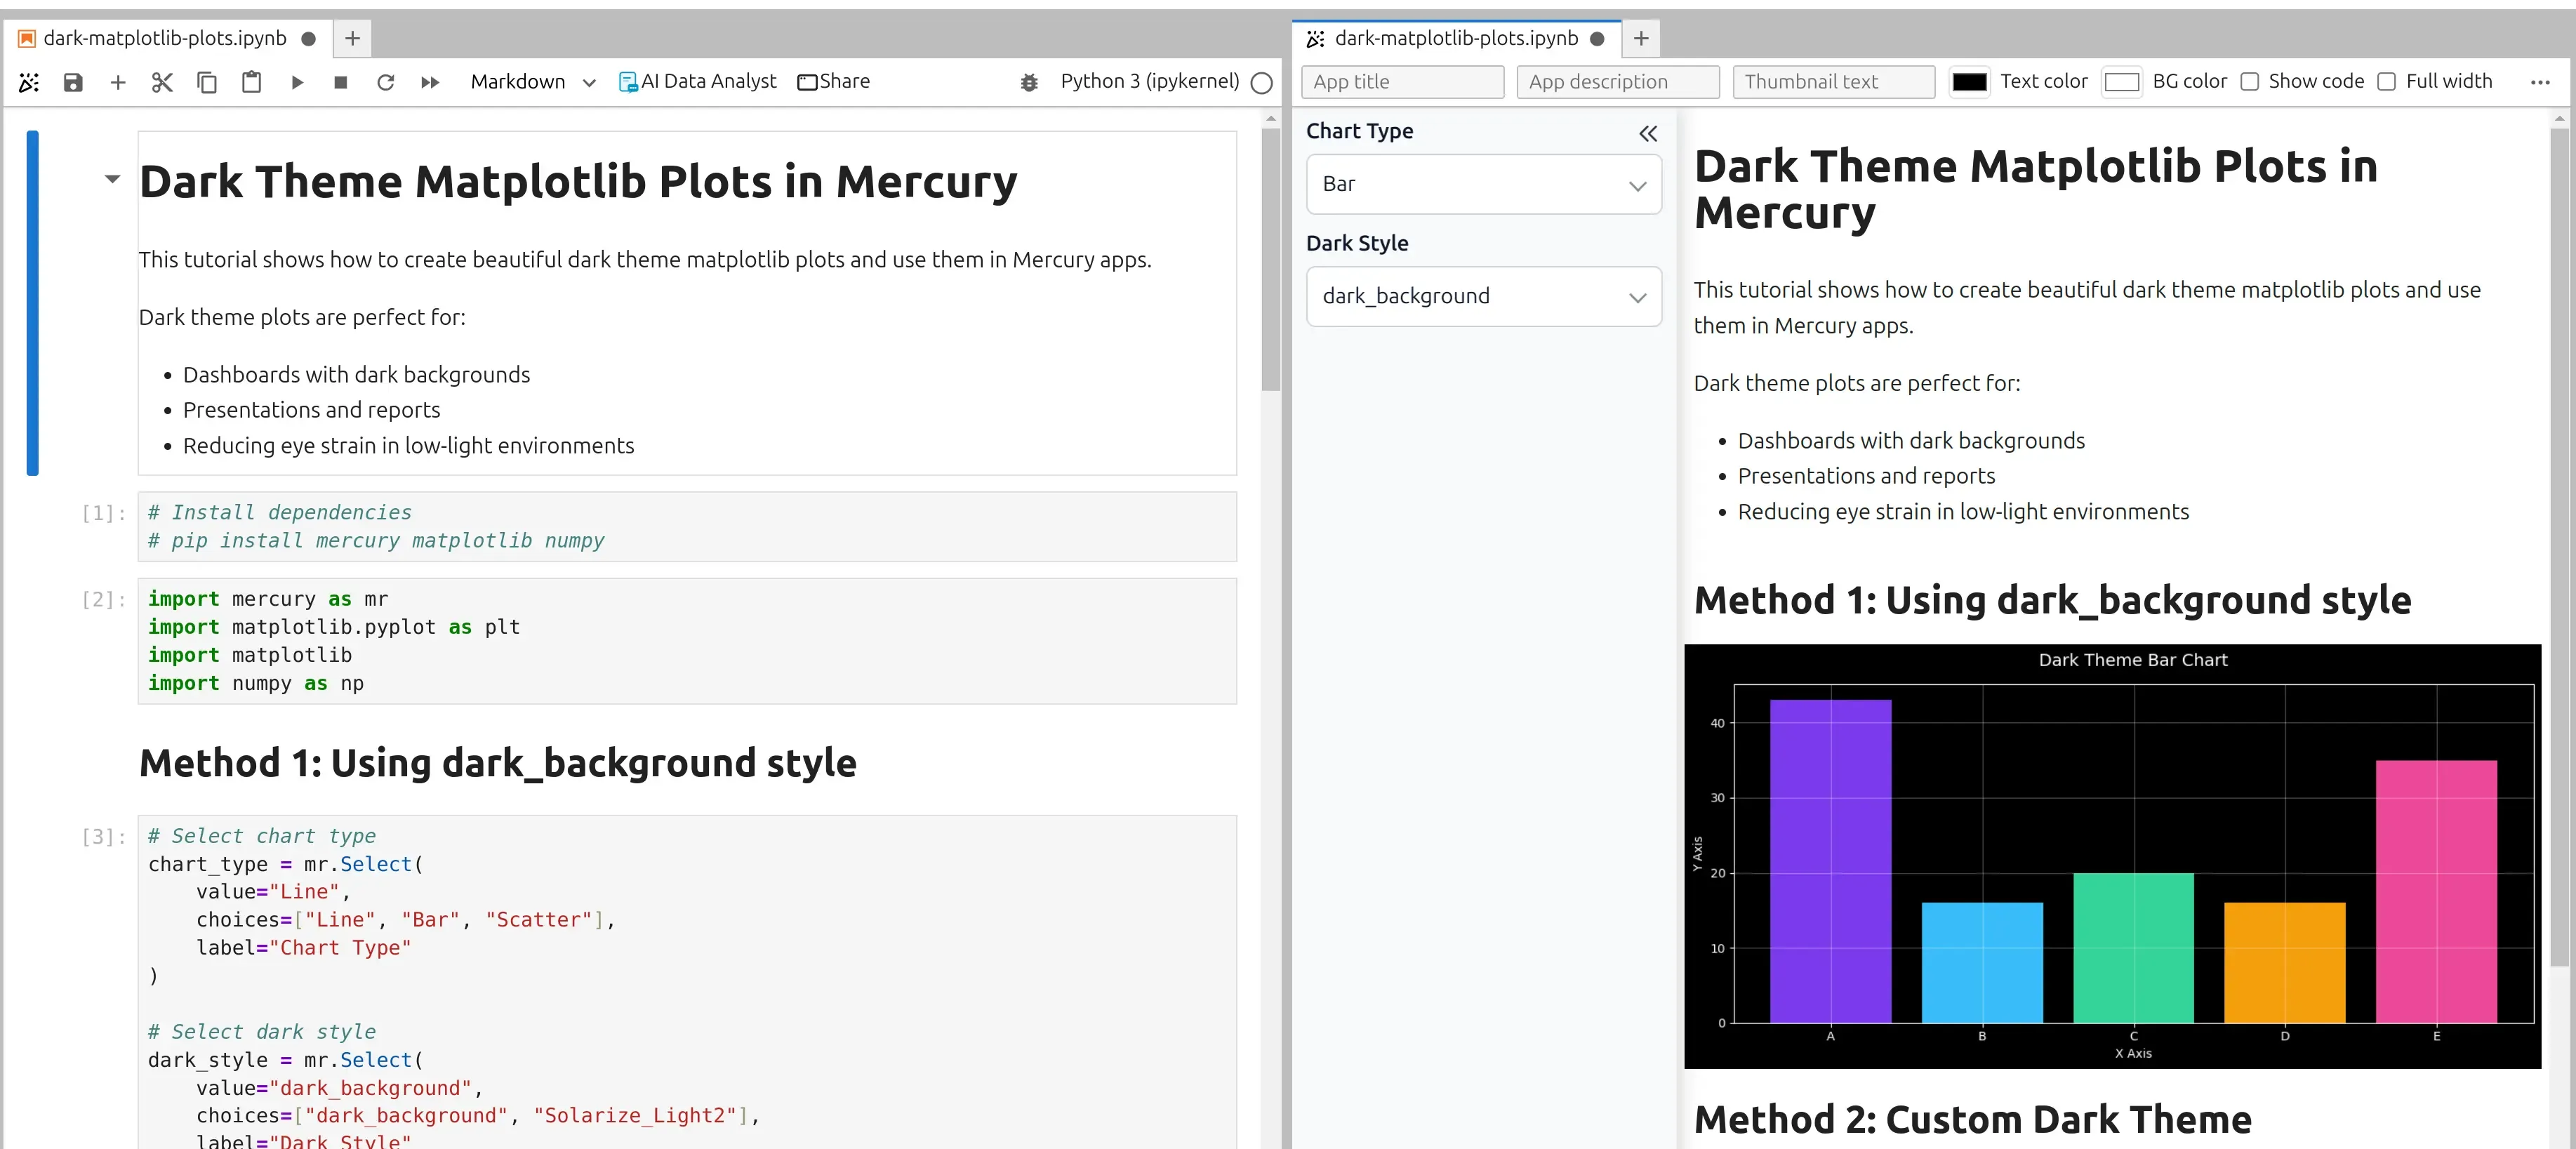
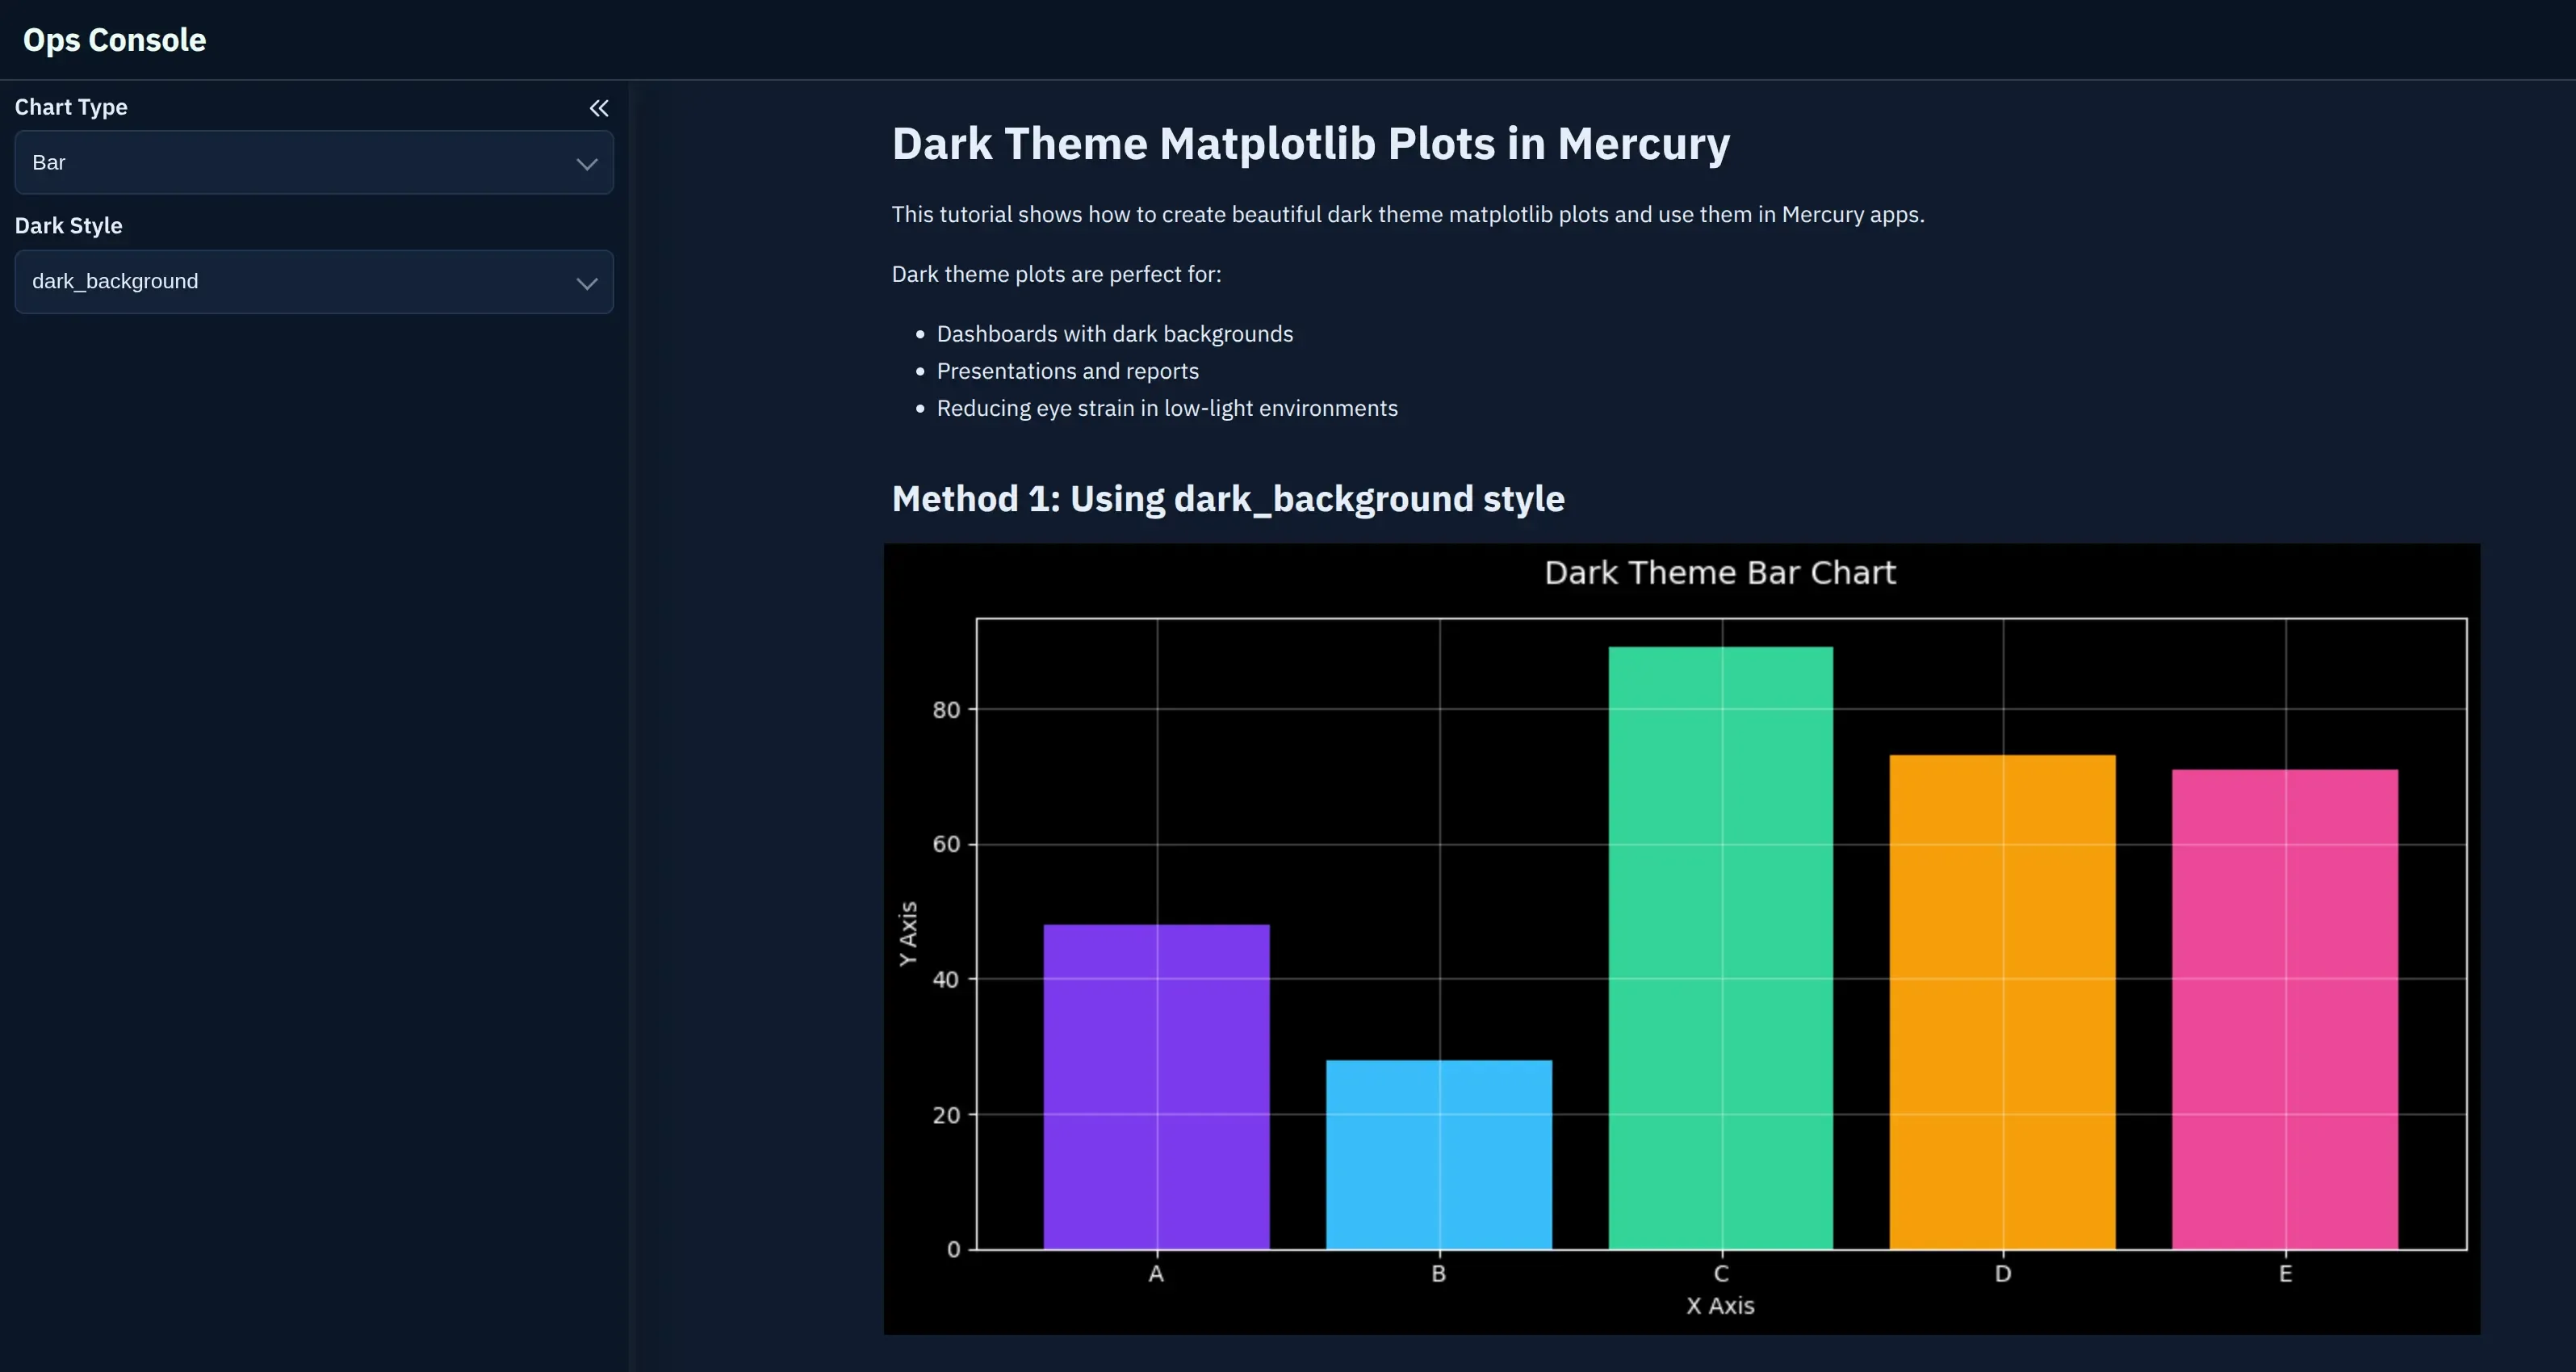
Section titled “2. Use a Built-in Dark Style”Matplotlib has built-in styles. One of them is called "dark_background".
It changes the plot background, text colors, axes, and grid so the chart looks good on a dark background.
In Mercury, we can also add widgets to make the chart interactive.
import mercury as mrimport matplotlib.pyplot as pltimport numpy as np
# Select chart typechart_type = mr.Select(    value="Line",    choices=["Line", "Bar", "Scatter"],    label="Chart Type")
# Select Matplotlib styledark_style = mr.Select(    value="dark_background",    choices=["dark_background", "Solarize_Light2"],    label="Plot Style")
Now we can generate sample data and display the chart.
# Generate sample datax = np.linspace(0, 10, 100)y1 = np.sin(x)y2 = np.cos(x)y3 = np.sin(x) * np.cos(x)
# Apply selected stylewith plt.style.context(dark_style.value):    fig, ax = plt.subplots(figsize=(10, 5))
    if chart_type.value == "Line":        ax.plot(x, y1, color="#7C3AED", linewidth=2, label="sin(x)")        ax.plot(x, y2, color="#38BDF8", linewidth=2, label="cos(x)")        ax.plot(x, y3, color="#34D399", linewidth=2, label="sin(x)cos(x)")
    elif chart_type.value == "Bar":        categories = ["A", "B", "C", "D", "E"]        values = np.random.randint(10, 100, 5)        colors = ["#7C3AED", "#38BDF8", "#34D399", "#F59E0B", "#EC4899"]        ax.bar(categories, values, color=colors)
    elif chart_type.value == "Scatter":        scatter_x = np.random.randn(100)        scatter_y = np.random.randn(100)        ax.scatter(scatter_x, scatter_y, color="#7C3AED", alpha=0.6, s=50)
    ax.set_title(f"Dark Theme {chart_type.value} Chart", fontsize=14, pad=15)    ax.set_xlabel("X Axis")    ax.set_ylabel("Y Axis")
    if chart_type.value == "Line":        ax.legend()
    ax.grid(True, alpha=0.3)    plt.tight_layout()    plt.show()
This is the simplest way to make Matplotlib plots match a dark Mercury app.
3. Create a Custom Dark Theme
Section titled “3. Create a Custom Dark Theme”The built-in style is a great start, but sometimes you want full control over colors.
For example, you might want to use your own background color, grid color, text color, or brand colors.
Matplotlib allows this with matplotlib.rc_context().
custom_dark = { "figure.facecolor": "#0f0f0f", "axes.facecolor": "#1a1a1a", "axes.edgecolor": "#333333", "axes.labelcolor": "#ffffff", "text.color": "#ffffff", "xtick.color": "#6B7280", "ytick.color": "#6B7280", "grid.color": "#333333", "grid.alpha": 0.5,}Now we can use this style only for selected plots.
with matplotlib.rc_context(custom_dark):    fig, axes = plt.subplots(1, 2, figsize=(12, 5))
    # Plot 1 - Line chart    axes[0].plot(x, y1, color="#A78BFA", linewidth=2)    axes[0].fill_between(x, y1, alpha=0.2, color="#A78BFA")    axes[0].set_title("Custom Dark Line Chart")    axes[0].grid(True)
    # Plot 2 - Bar chart    categories = ["Mon", "Tue", "Wed", "Thu", "Fri"]    values = [23, 45, 32, 67, 54]
    axes[1].bar(        categories,        values,        color=["#A78BFA", "#38BDF8", "#34D399", "#F59E0B", "#EC4899"]    )    axes[1].set_title("Custom Dark Bar Chart")    axes[1].grid(True, axis="y")
    plt.tight_layout()    plt.show()
The custom theme gives you more control. You can match the plot with your Mercury app theme, your company colors, or your dashboard design.
4. Why Dark Plots Look Better in Dark Apps
Section titled “4. Why Dark Plots Look Better in Dark Apps”When your Mercury app uses a dark style, dark plots make the whole app feel consistent.
It is especially useful for:
- dashboards with key metrics,
- data science reports,
- monitoring apps,
- machine learning demos,
- presentations,
- apps used in low-light environments.
Small visual changes can make your app look much more polished.
Summary
Section titled “Summary”You can create dark Matplotlib plots in Mercury in two simple ways:
- Use the built-in Matplotlib style
"dark_background"for a quick dark theme. - Use
matplotlib.rc_context()to define your own custom dark colors.
Both methods are beginner-friendly and work well with Mercury widgets.
If your Mercury app uses a dark theme, it is worth styling your plots too. The app will look cleaner, more professional, and easier to read.