Create reports with Python
In this tutorial, we are going to create a simple financial report for stock companies. The report will be generated based on the ticker and selected time period. The report will consist of:
- basic statistics about the company,
- plot showing the historical prices,
- Data Frame with latest data.
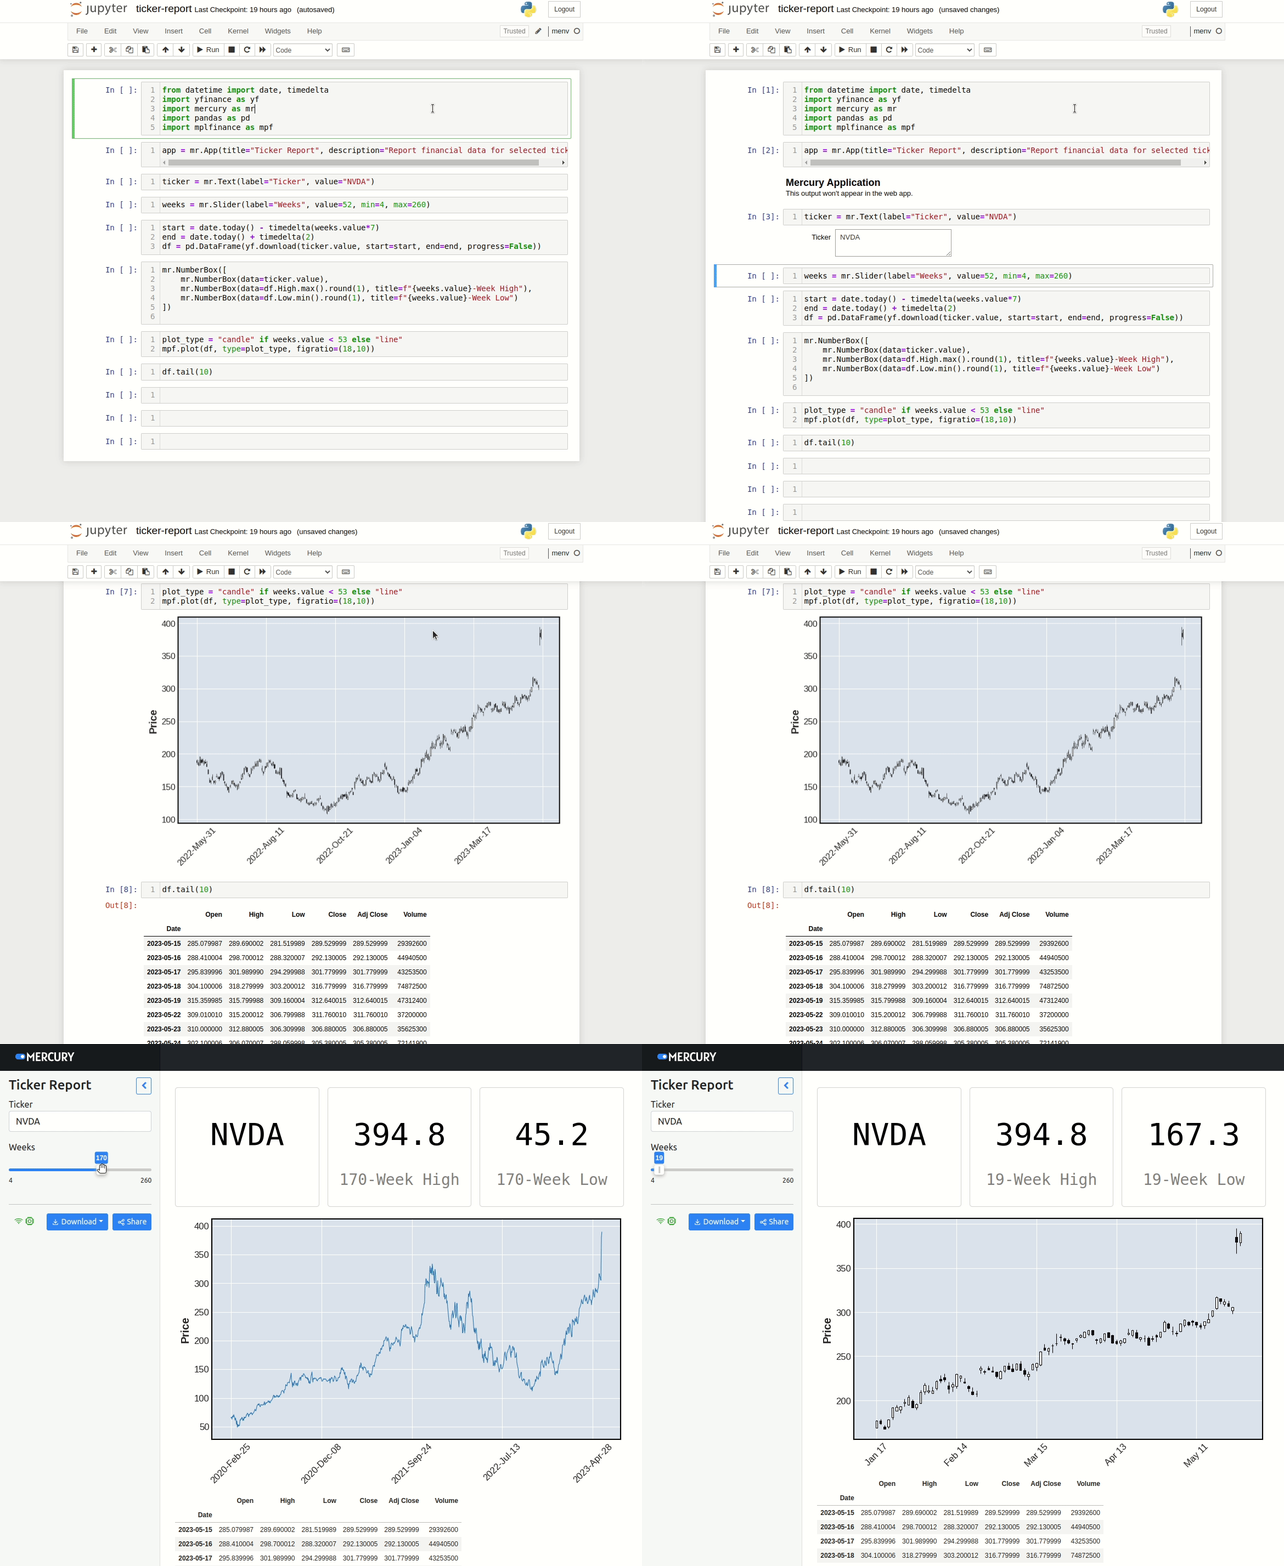
Here is a preview of the notebook and ready report:

Import required packages
We need to install the following packages:
mercury
pandas
yfinance
mplfinancemercurywill be used for interactive widgets and for running notebook as a web app,pandasis for data manipulation,yfinancewill be used for downloading historical financial data,mplfinanceis a plotting package for financial data.
The cell code with imports is below:
from datetime import date, timedelta
import yfinance as yf
import mercury as mr
import pandas as pd
import mplfinance as mpf
Add interactive widgets
In the next three cells, we will setup web app properties (title and description) and add interactive widgets.
Please create the App object to control app properties:
app = mr.App(title="Ticker Report", description="Report financial data for selected ticker")Then let's add Text widget for ticker:
ticker = mr.Text(label="Ticker", value="NVDA")The Slider widget to control history length:
weeks = mr.Slider(label="Weeks", value=52, min=4, max=260)Please notice that during the development of the notebook, nothing happens after the widget change. You can interact with the widget but to see changes in other cells you need to execute them manually,
When the notebook is served with mercury then cells are automatically re-executed after the widget update. Only cells below the updated widget are re-executed.
Load data
Let's create a Data Frame with our data:
start = date.today() - timedelta(weeks.value*7)
end = date.today() + timedelta(2)
df = pd.DataFrame(yf.download(ticker.value, start=start, end=end, progress=False))
Display metrics
We can use NumberBox to display important metrics:
mr.NumberBox([
    mr.NumberBox(data=ticker.value),
    mr.NumberBox(data=df.High.max().round(1), title=f"{weeks.value}-Week High"),
    mr.NumberBox(data=df.Low.min().round(1), title=f"{weeks.value}-Week Low")
])
Display plot
Ploting financial data with mplfinance is very easy:
plot_type = "candle" if weeks.value < 53 else "line"
mpf.plot(df, type=plot_type, figratio=(18,10))
Please notice that we do a candle plot for short periods (less than 1 year) and a line plot for longer periods.
Display Data Frame
Call tail(10) on our Data Frame to display the latest 10 samples of data:
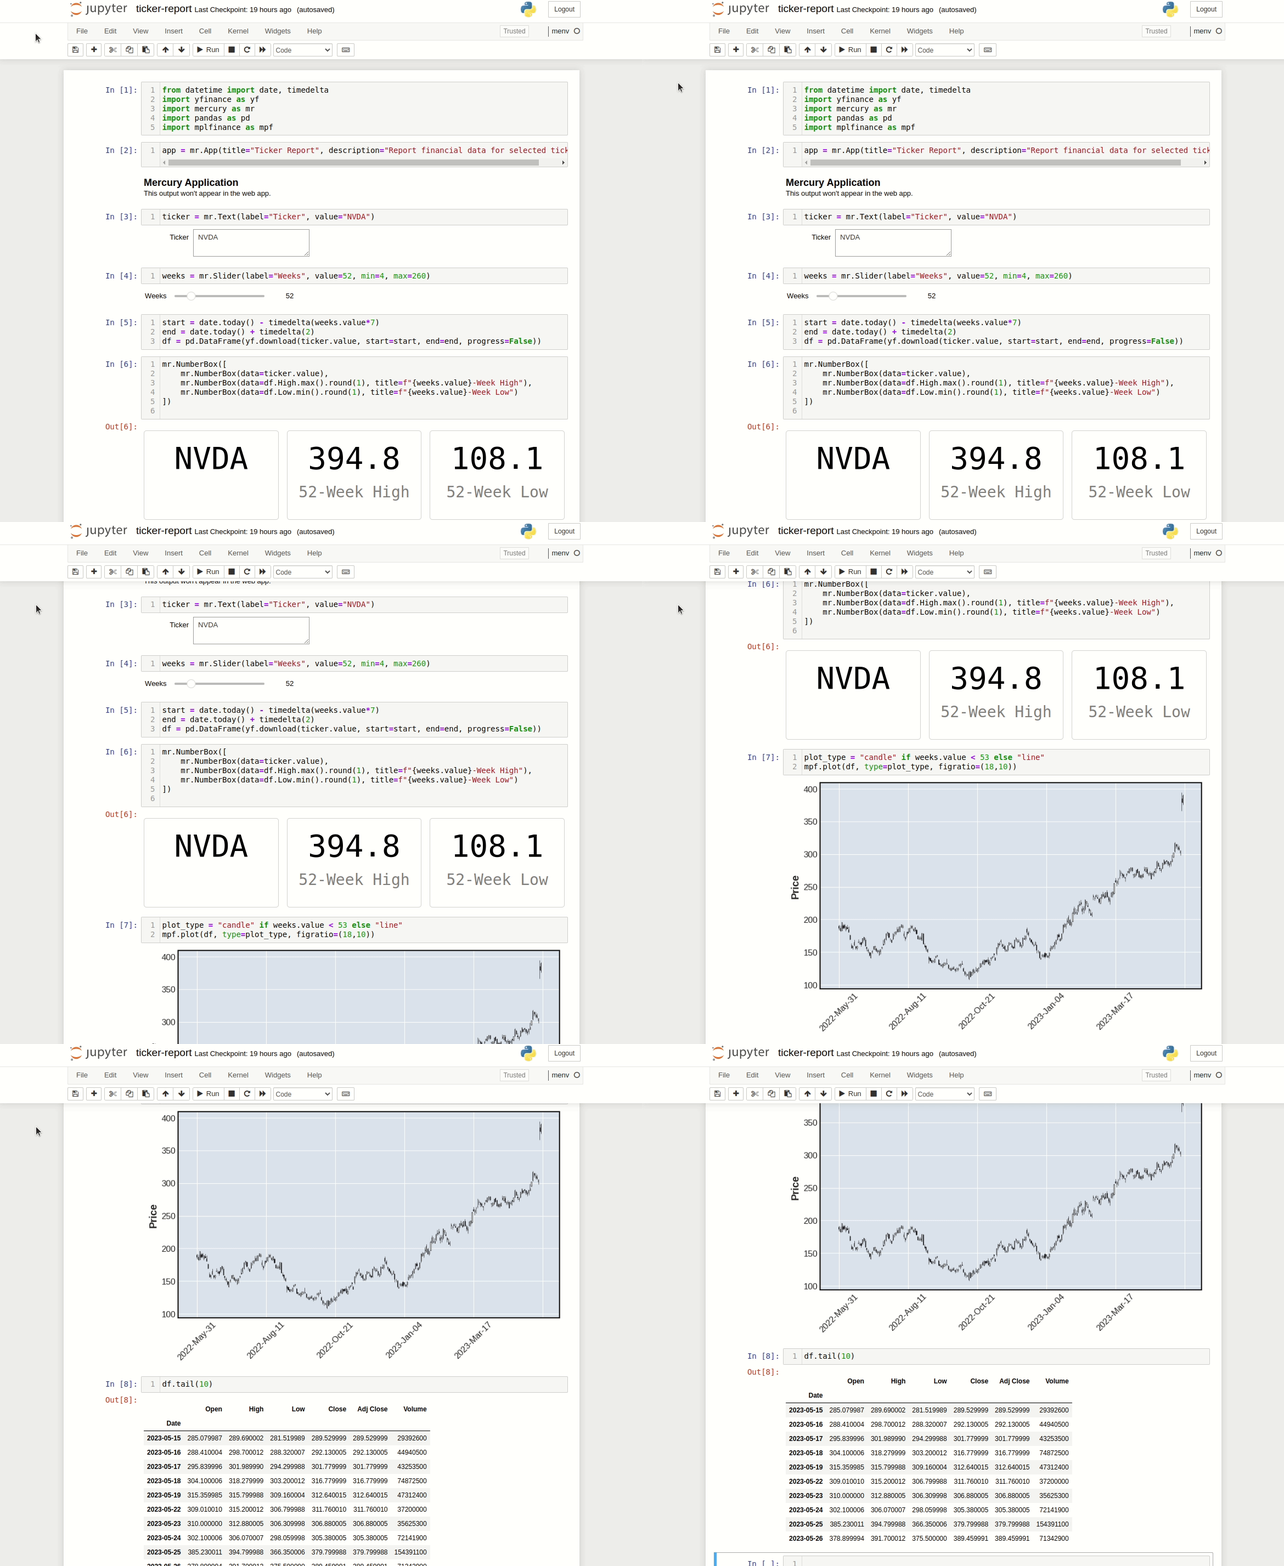
df.tail(10)Below is our notebook in the Jupyter:

Run as a Web App
In the same directory as the notebook file, please start the mercury server with the below command:
mercury runIt will start the local server and publish all notebooks from the current directory as web applications. Please open http://127.0.0.1:8000 and check your app.
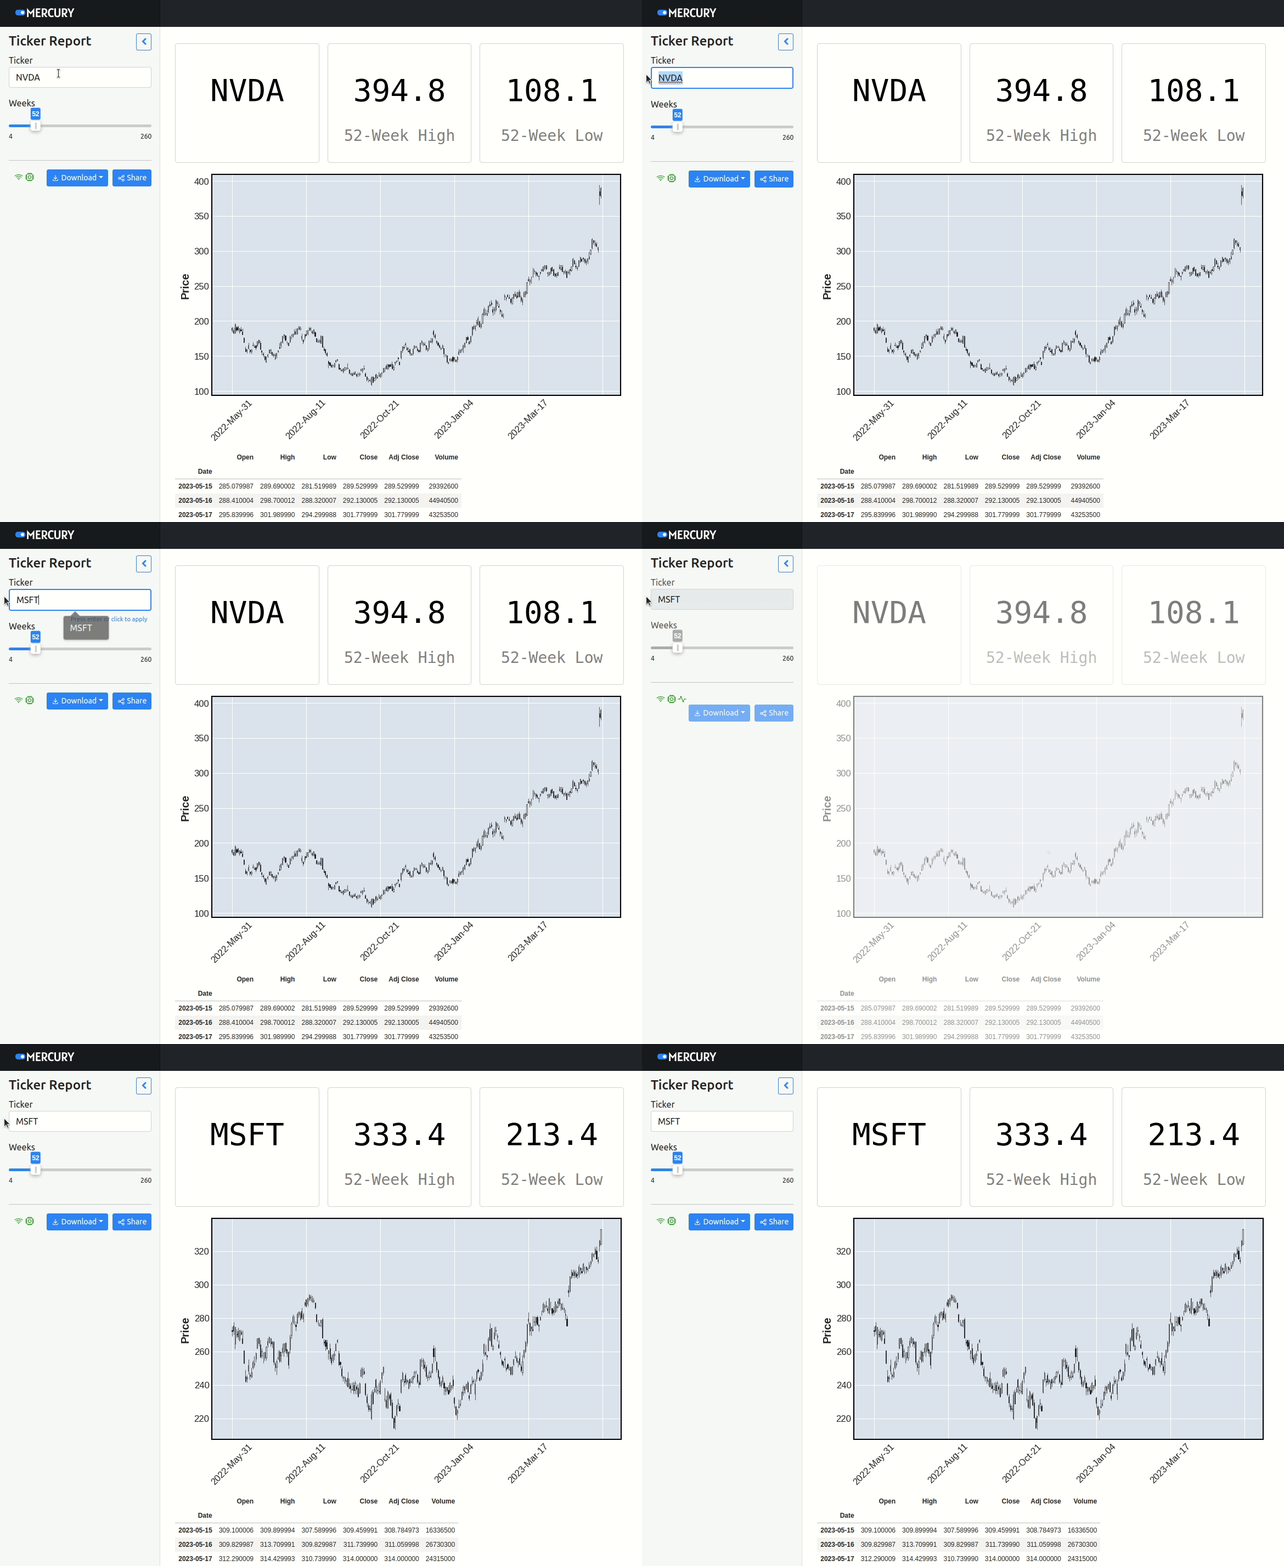
You can change the ticker value and control history with the slider:

Deployment
The easiest way to deploy notebooks is to use Mercury Cloud (opens in a new tab). Here is the app deployed in the Mercury Cloud: use-cases.runmercury.com/app/ticker-report (opens in a new tab).
There are many options to self-host Mercury. Please check documentation for more details.