Create dashboard with Python in 10 Jupyter Notebook cells
In this tutorial we will create a simple financial dashboard. Code development will be performed in the Jupyter Notebook. The resulting notebook will be served with Mercury as a dashboard. Python code will be hidden.
In the dashboard there will be stock infomation. The DataFrame with last data and candle plot from last 3 months.
We will use one Mercury Widget: Select for choosing stock.
Create a notebook
We will need following packages:
yfinance
mplfinance
mercuryyfinanceis package to fetch latest stock data,mplfinanceis matplotlib addin with financial charts,mercuryis a package for turning notebooks to web apps.
Please make sure that you have installed them.
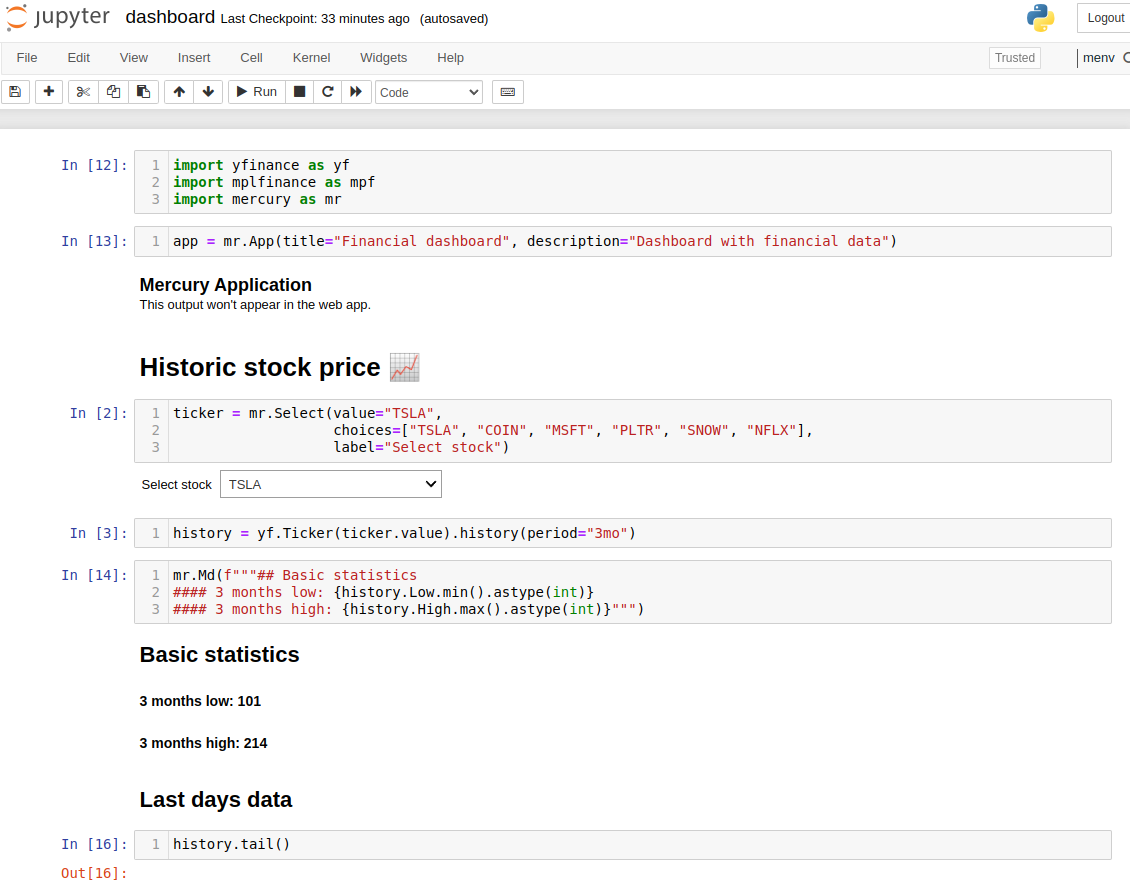
1. Import packages
In the frist cell, we will import required packages:
import yfinance as yf
import mplfinance as mpf
import mercury as mr
2. Setup Mercury App
In the second cell, we will setup Mercury App properties:
title- it will appear in the sidebar,description- it will appear in the home view.
app = mr.App(title="Financial dashboard", description="Dashboard with financial data")We don't set show_code parameter in App object, because by default it is set to False.
If you would like to show code in your notebook, please set show_code=True.
3. Add title
Please add a Markdown cell with a header:
# Historic stock price 📈4. Add Mercury Select
In the next cell, we will add a Select widget:
ticker = mr.Select(value="TSLA",
                   choices=["TSLA", "COIN", "MSFT", "PLTR", "SNOW", "NFLX"],
                   label="Select stock")
Please note, that it will display widget in the notebook. You can interact with it. There are no other actions performed in the notebook. Only value of the widget is updated.
5. Load historic stock data
We will load the data with yfinance package:
history = yf.Ticker(ticker.value).history(period="3mo")That's all. It is done with 1 line of code.
The value of the widget is obtained with ticket.value.
6. Display basic statistics
We will create a Markdown text with Python variables. Let's use Md from Mercury:
mr.Md(f"""## Basic statistics
#### 3 months low: {history.Low.min().astype(int)}
#### 3 months high: {history.High.max().astype(int)}""")
The above code will display Markdown text.
7. Add subtitle
Please add a Markdown cell with subtitle:
## Last days data8. Display historic data
Let's display the last rows from history DataFrame:
history.tail()9. Add subtitle
Please add a Makdown cell:
## Candle chart 🕯️10. Display candle plot
We will use mplfinance to easily create candle plot:
mpf.plot(history, type='candle', mav=(7),figratio=(18,10))Here is presented notebook with dashboard code:
You can interact with Mercury Widgets in the notebook. Widgets values will be updated. There are no othe actions peformed. If you would like to update cells with new widget's values. Please execute cell manually.
When you run notebook in Mercury, cells below widgets definition are automatically re-executed.
Dashboard in Mercury
The last step is to run notebook in Mercury. Please run the following command in the directory where notebook is saved:
mercury runIt will open a web browser at address http://1270.0.1:8000. You should see a card with Financial dashboard title. Please click on the title.
You can play with the dashboard. Please change the stock, the results should be automatically updated:
Mercury has option to export executed notebook to PDF or HTML. It is very simple. Please click Download button in the sidebar and select desired format: