Chat message with a Matplotlib chart
Mercury chat Message can display charts, tables, and rich outputs, not only text.
In this example, the assistant responds with a Matplotlib chart based on sales data.
App preview
Section titled “App preview”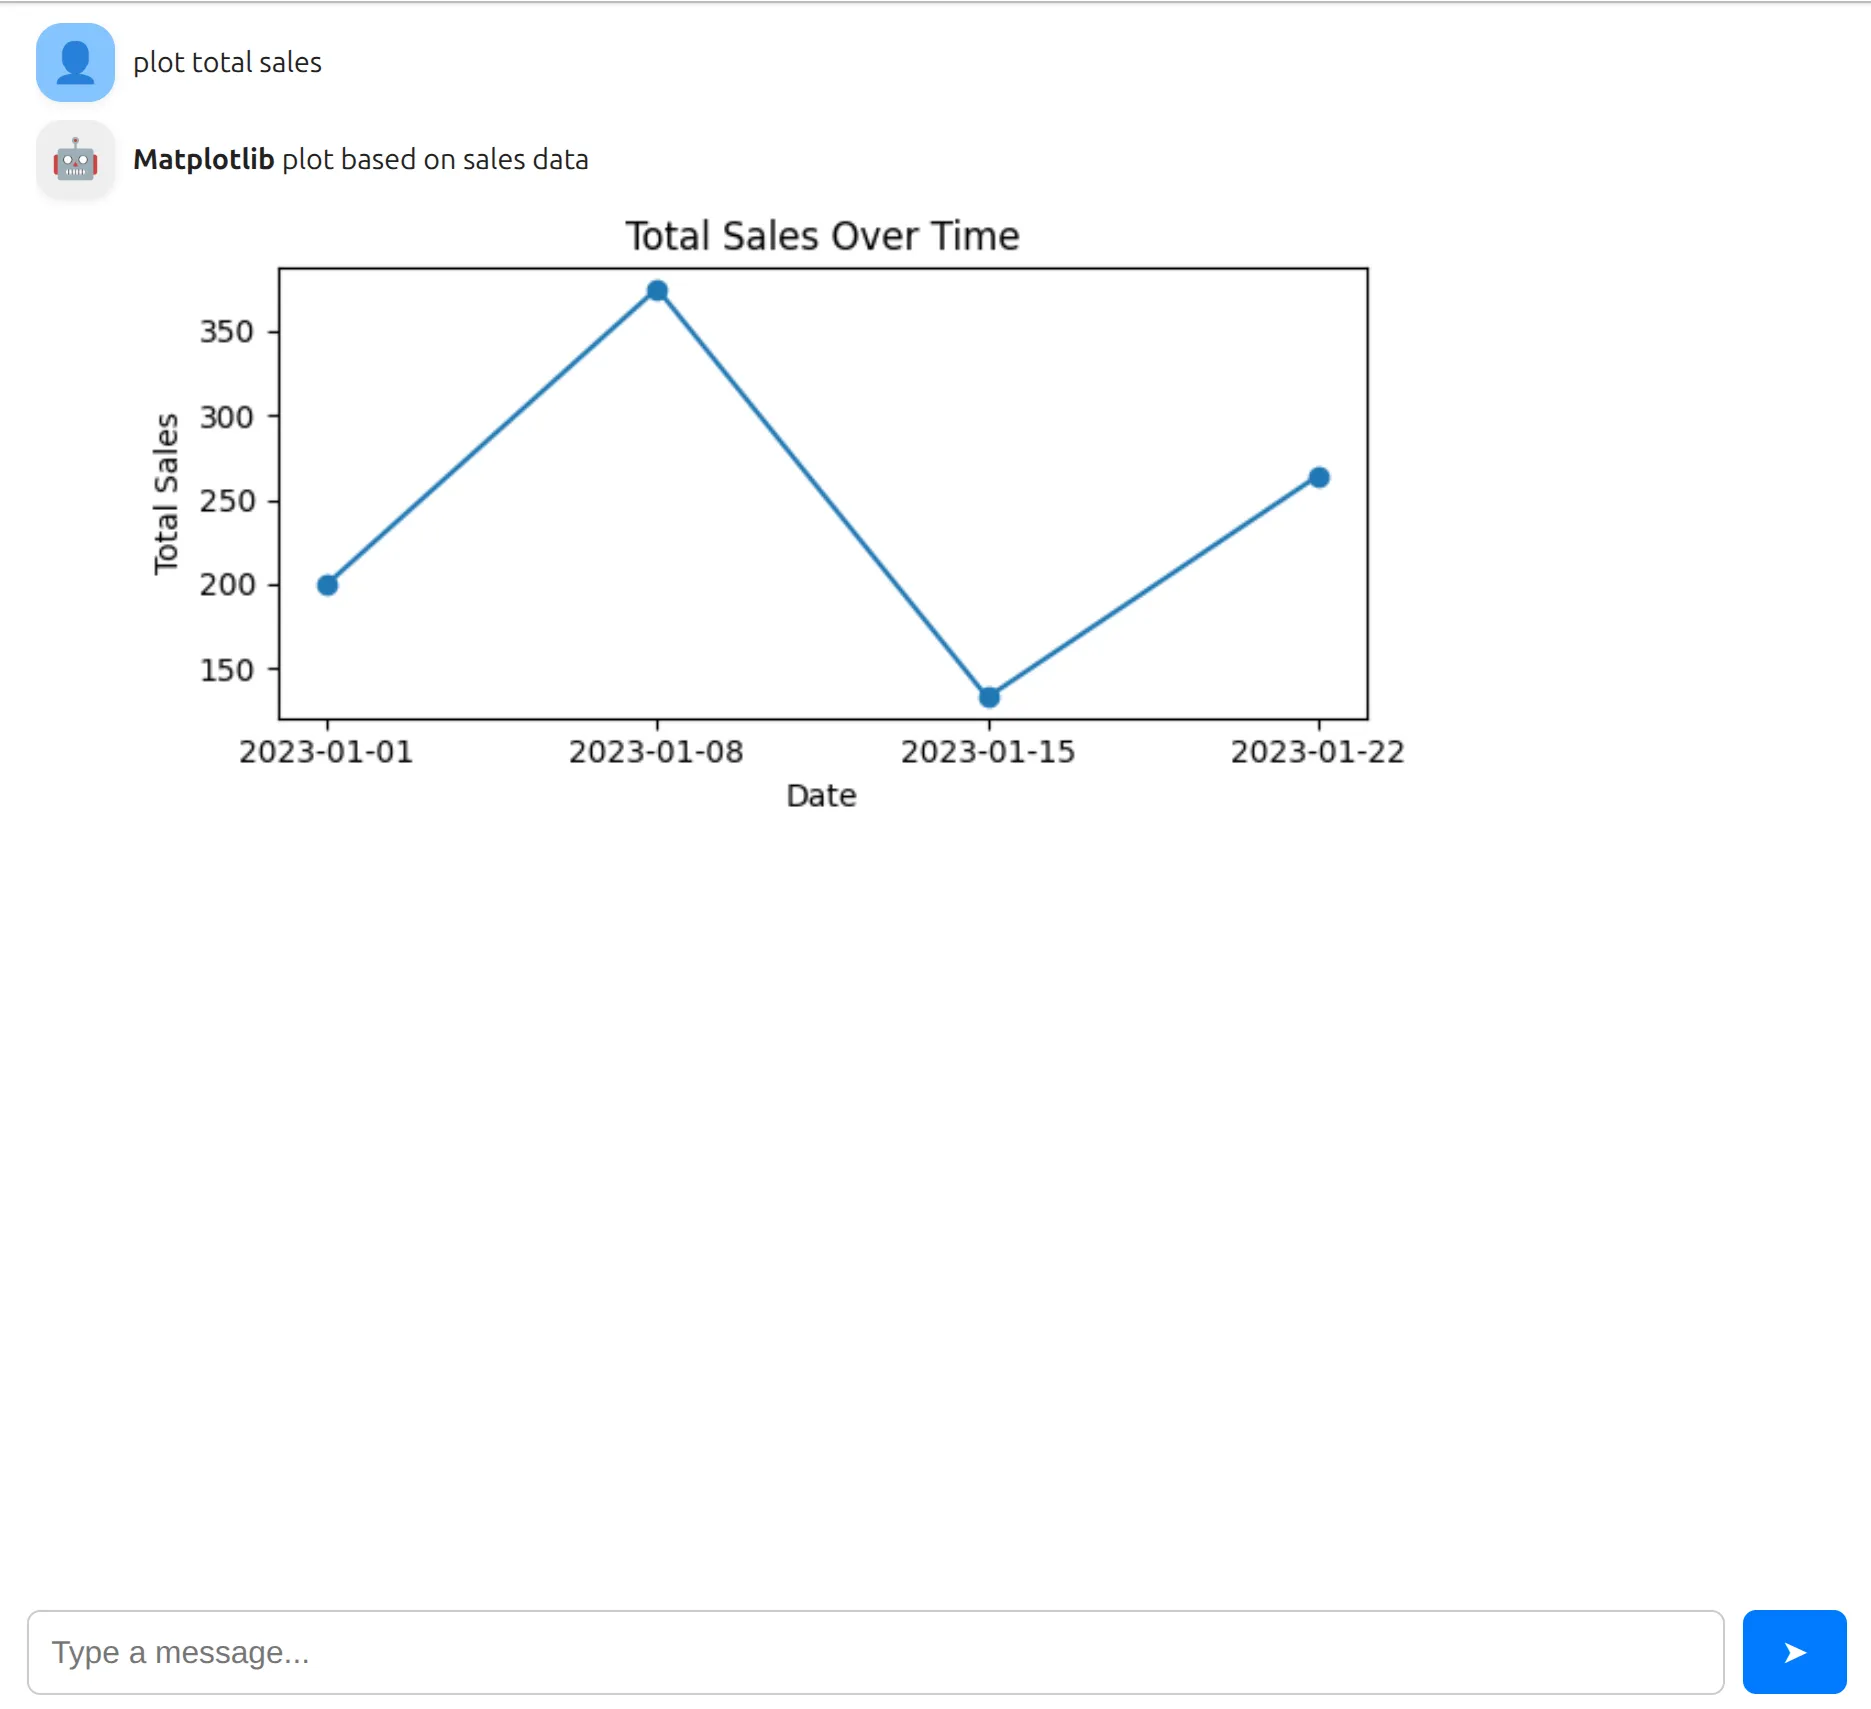
You can try the live web app:
1. Import Mercury
Section titled “1. Import Mercury”In the first notebook cell, import Mercury:
import mercury as mrWe will use mr alias to create all widgets.
2. Example data
Section titled “2. Example data”In the second cell, let’s prepare a simple sales dataset.
import pandas as pd
sales_df = pd.DataFrame({    "date": ["2023-01-01", "2023-01-08", "2023-01-15", "2023-01-22"],    "region": ["North", "South", "East", "West"],    "product": ["A", "B", "A", "C"],    "units_sold": [10, 15, 7, 12],    "unit_price": [20, 25, 19, 22],})
sales_df["total_sales"] = sales_df["units_sold"] * sales_df["unit_price"]
3. Create chat and input
Section titled “3. Create chat and input”Now create the Chat area, it will display all messages.
chat = mr.Chat()In the next cell, please create the ChatInput to accept user prompts:
prompt = mr.ChatInput()4. Respond with a chart
Section titled “4. Respond with a chart”When the user sends a message:
- We add the user message to the chat
- We create an assistant message
- Inside the message, we draw a Matplotlib chart
- The chart is displayed inside the chat bubble
import matplotlib.pyplot as plt
if prompt.value:    # user message    user_msg = mr.Message(prompt.value, role="user")    chat.add(user_msg)
    # assistant message    response_msg = mr.Message(        "**Matplotlib** plot based on sales data",        role="assistant",        emoji="🤖",    )
    with response_msg:        # create figure        fig, ax = plt.subplots(figsize=(6, 3))        ax.plot(sales_df["date"], sales_df["total_sales"], marker="o")        ax.set_xlabel("Date")        ax.set_ylabel("Total Sales")        ax.set_title("Total Sales Over Time")
        fig.tight_layout()
        # important: close the figure        plt.close(fig)
        # display figure inside the chat message        display(fig)
    chat.add(response_msg)
Why this works
Section titled “Why this works”Messagecan display text, markdown, HTML, charts and tables.- Everything inside
with response_msg:is rendered in the response message. display(fig)shows the Matplotlib figureplt.close(fig)prevents extra empty space and duplicated plots