Chat message with an Altair chart
Mercury chat Message can display interactive charts, tables, and rich outputs.
In this example, the assistant responds with an Altair chart based on sales data.
App preview
Section titled “App preview”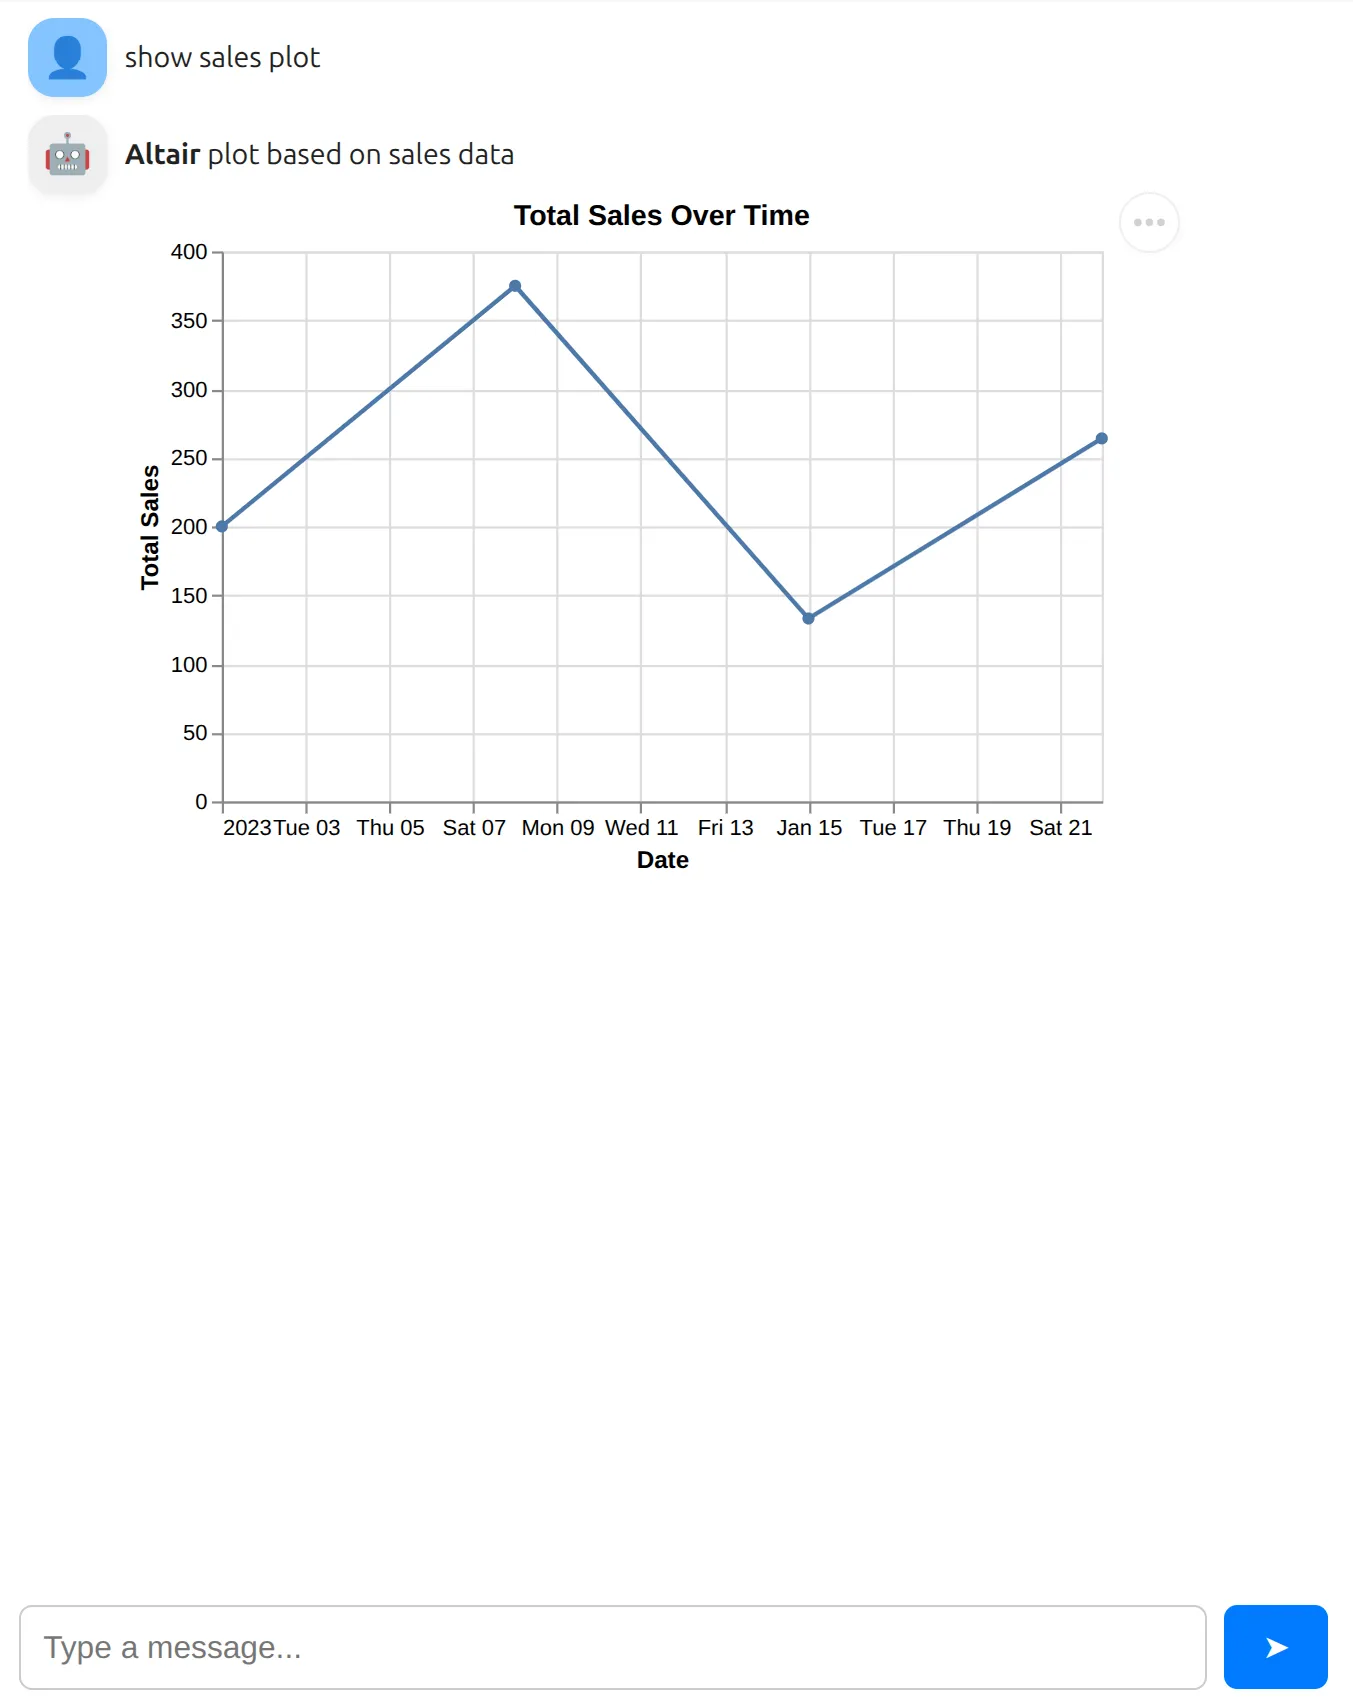
Try the live web app:
1. Import Mercury and Altair
Section titled “1. Import Mercury and Altair”In the first notebook cell, import required libraries:
import mercury as mrimport pandas as pdimport altair as altWe use following aliases:
mrfor Mercury widgetspandasfor dataaltairfor interactive charts
2. Example data
Section titled “2. Example data”Prepare a simple sales dataset:
sales_df = pd.DataFrame({    "date": ["2023-01-01", "2023-01-08", "2023-01-15", "2023-01-22"],    "region": ["North", "South", "East", "West"],    "product": ["A", "B", "A", "C"],    "units_sold": [10, 15, 7, 12],    "unit_price": [20, 25, 19, 22],})
sales_df["total_sales"] = sales_df["units_sold"] * sales_df["unit_price"]
3. Create chat and input
Section titled “3. Create chat and input”Create the Chat widget:
chat = mr.Chat()In the next cell, create the ChatInput widget:
prompt = mr.ChatInput()4. Respond with an Altair chart
Section titled “4. Respond with an Altair chart”When the user sends a message:
- The cell below
ChatInputis re-executed - The user message is added to the chat
- The assistant creates an Altair chart
- The chart is displayed inside the chat message
if prompt.value:    # user message    user_msg = mr.Message(prompt.value, role="user")    chat.add(user_msg)
    # assistant message    response_msg = mr.Message(        "**Altair** plot based on sales data",        role="assistant",        emoji="🤖",    )
    with response_msg:        # prepare data        df = sales_df.copy()        df["date"] = pd.to_datetime(df["date"])
        # create Altair chart        chart = (            alt.Chart(df)            .mark_line(point=True)            .encode(                x=alt.X("date:T", title="Date"),                y=alt.Y("total_sales:Q", title="Total Sales"),                tooltip=["date:T", "total_sales:Q"],            )            .properties(                width=400,                height=250,                title="Total Sales Over Time",            )        )        # display chart in the message        display(chart)
    chat.add(response_msg)
Why this works
Section titled “Why this works”ChatInputautomatically re-runs the cell below itprompt.valuecontains the latest user message- Your code reacts and appends new messages to the chat
No callbacks. No JavaScript. No async code.